Boost Site Speed with PageSpeed Insights in Customer Portal
Website speed is an important factor in both user experience and SEO rankings. Slow-loading pages can lead to high bounce rates, lower conversions, and poor SEO performance. To help you address these issues, HostGator has integrated PageSpeed Insights directly into your Customer Portal. This powerful tool allows you to quickly assess your website’s performance and identify opportunities to improve loading times for a better user experience.
In this article, we’ll walk you through using the Google PageSpeed Insights tool within your HostGator Customer Portal to optimize your website speed and performance.
What is Google PageSpeed Insights?
Google PageSpeed Insights (PSI) is a valuable tool that helps website owners evaluate and improve their website’s speed. It provides performance scores for both desktop and mobile versions of your site, ranging from 0 to 100, with higher scores indicating better performance. By using PageSpeed Insights, you can gain actionable insights to enhance your site’s speed and optimize user experience.
For more information on how PageSpeed Insights works, check out Google’s documentation:
To learn about the PageSpeed Insights tool and discover effective strategies for optimizing your website based on the test results, please check out the following external article:
Benefits of Using PageSpeed Insights
Leveraging the PageSpeed Insights feature in your Customer Portal can significantly improve your website’s performance, leading to a better user experience and enhanced SEO rankings.
- Enhanced SEO Impact - Since Google uses page speed as a ranking factor, improving your PageSpeed Insights score can boost your site’s visibility in search engine results.
- Improved User Experience — Faster-loading websites can lead to lower bounce rates and higher user satisfaction, which are key components of successful SEO.
- Mobile Optimization - With the increasing number of users pulling up websites via their mobile devices, optimizing mobile performance is essential for better search rankings.
How to Navigate the PageSpeed Insights Panel
To access your PageSpeed Insights panel:
- Log in to your Customer Portal.
- Click Websites on the left-hand menu.
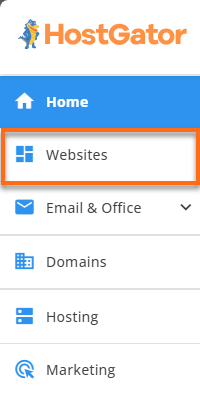
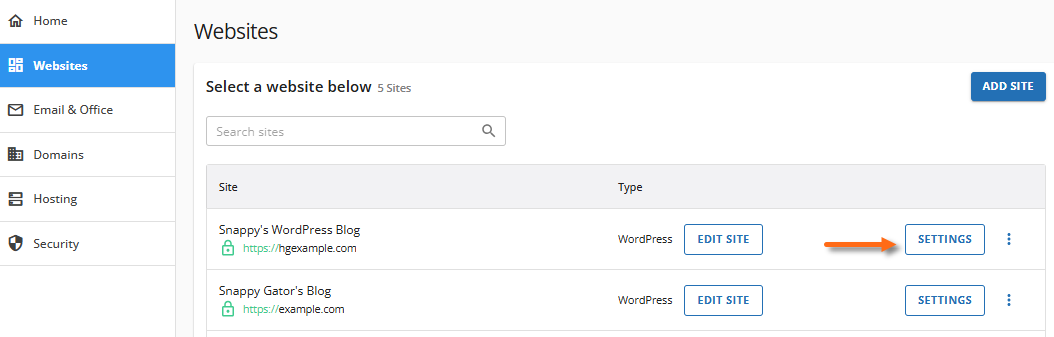
- Under Websites, locate the website you need to manage and click its Settings button.
- If you already run a test on your website, you can view its score under the Overview tab.
If you need to run a new test on your website or access the PageSpeed Insights card, click the Manage link under PageSpeed Insights.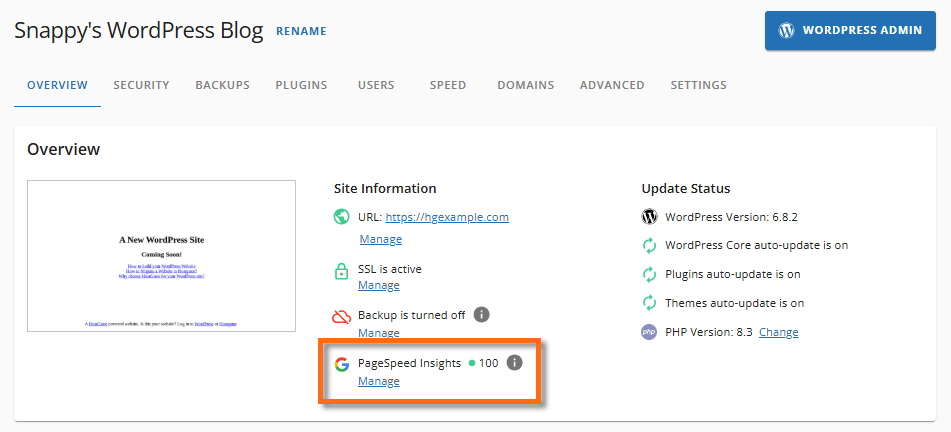
- Under the Speed tab, you will find the PageSpeed Insights card, as well as the Manage Cache and Cloudflare cards.
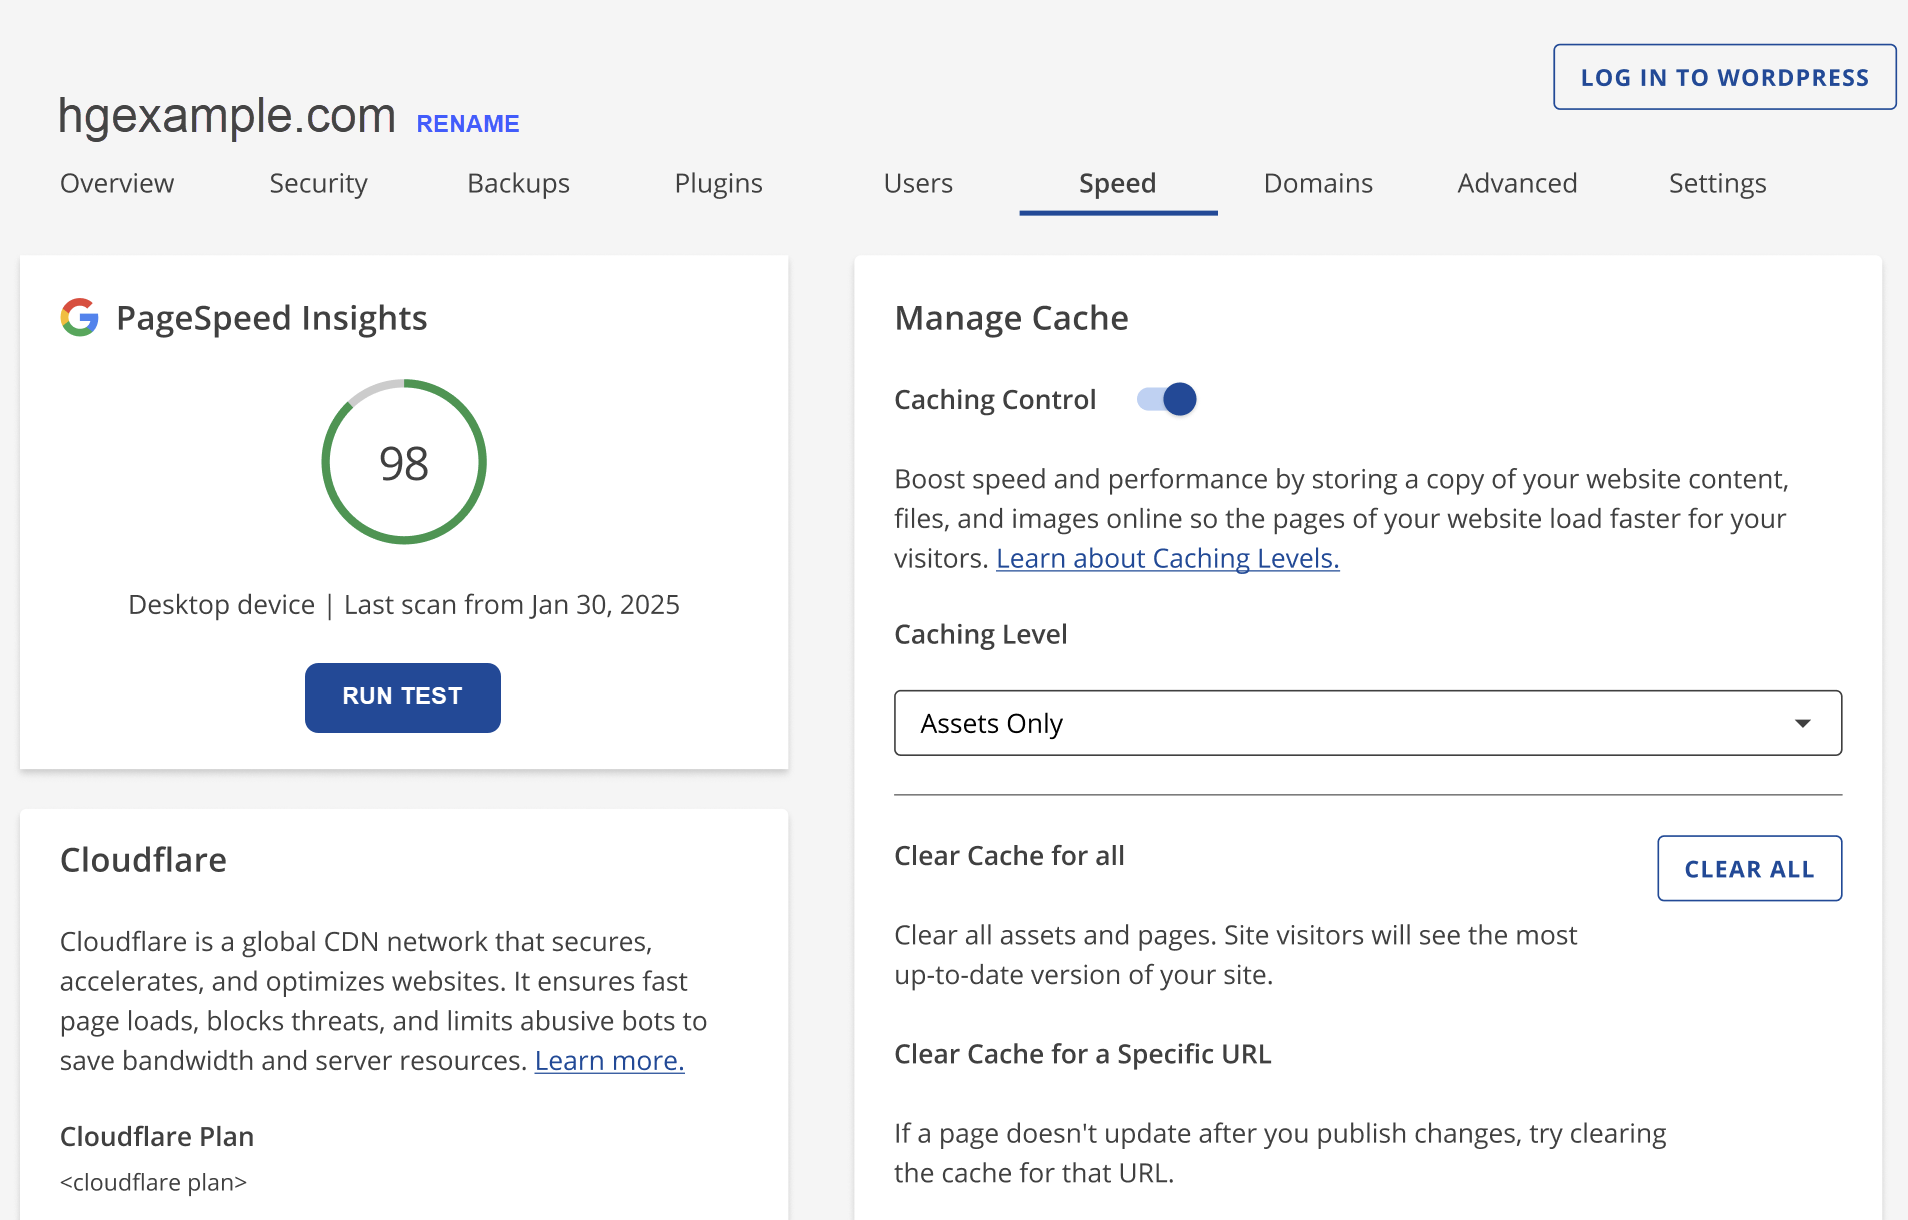
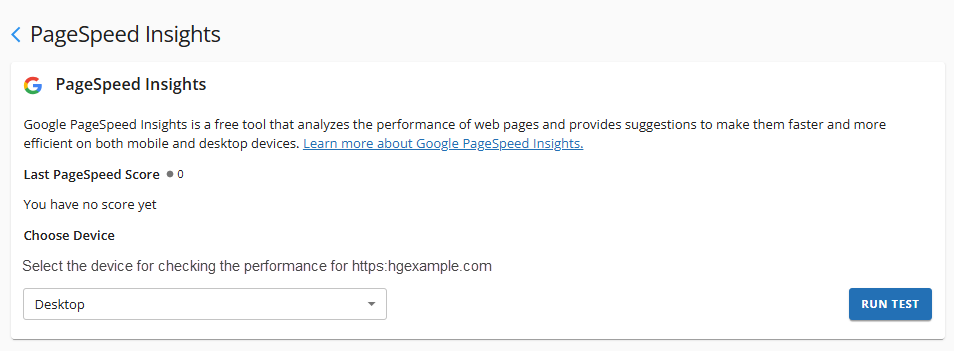
- Click on Run Test under the PageSpeed Insights card.
- Select your device type (Mobile or Desktop) from the Choose Device dropdown on the PageSpeed Insights panel, then click the Run Test button again to analyze your website's performance and generate a detailed report.
- Your site score will be displayed along with the metrics results. Click View Report to view the full metrics results.
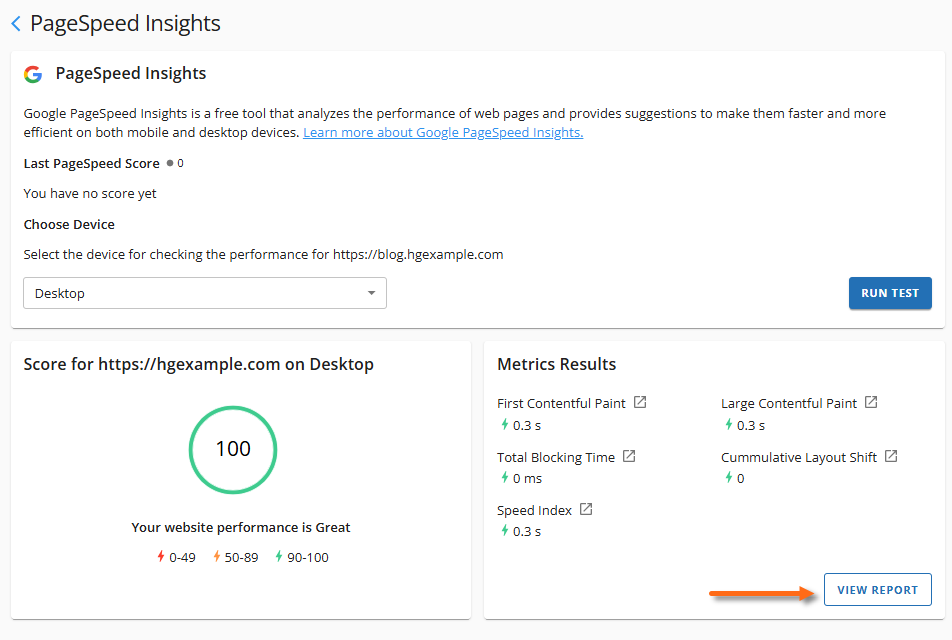
- A new tab will open displaying a full report of your website from Google PageSpeed Insights, where you can further explore your site's performance and review recommendations provided by Google.
You can also navigate to the PageSpeed Insights card by clicking the Speed tab in the top menu.
Analyzing the PageSpeed Performance Report
Here are some terms that will be useful when reviewing the PageSpeed Insights performance report.
- Scripts: A script is a small piece of code that instructs a webpage to perform a specific action.
- CSS: Cascading Style Sheets (CSS) are codes that determine how the webpage looks, including colors, font, and layout.
- HTML: HyperText Markup Language (HTML) structures the content on the webpage, such as the text, images, links, and headings.
- JavaScript: This type of script makes the webpage interactive. It controls actions like opening menus, showing pop-ups, and moving sliders.
- Minify: This means making a file smaller by removing extra spaces and formatting, which helps the webpage load faster.
- Main-Thread: This is the work the browser performs to load and process the webpage.
PageSpeed Performance Report Breakdown
In the Performance Issues section of the report, you will find the following sections:
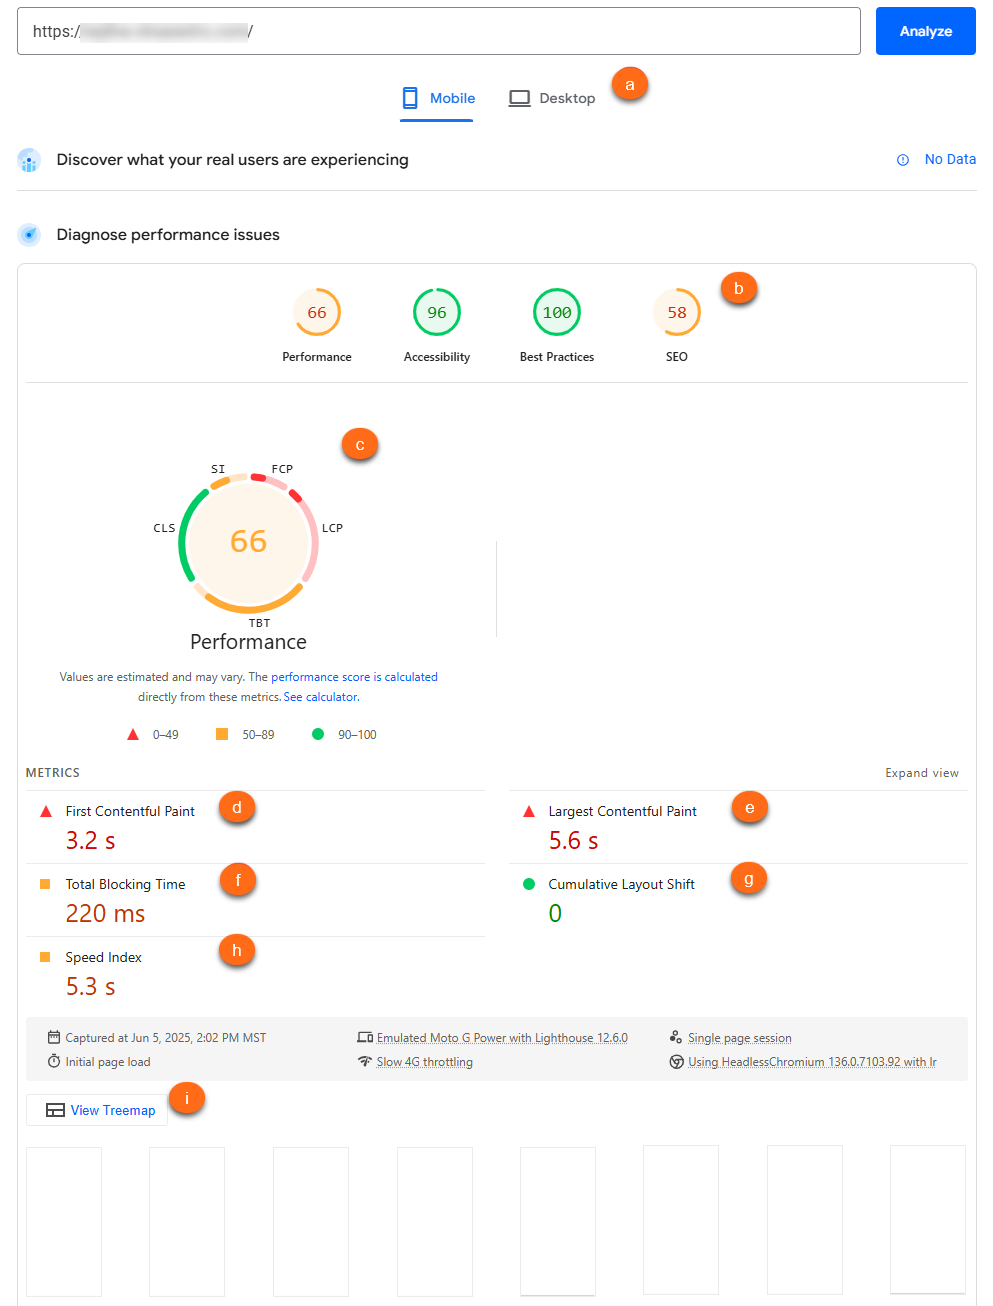
The image above shows sample PageSpeed diagnostic results.
| a: Mobile vs Desktop - You can toggle between Mobile and Desktop performance by clicking on these tabs. | f: Total Blocking Time - This is the time when the page loads but does not respond to the user input, aiding in diagnosing interactivity issues. |
b: Four Key Areas Rated - These are the primary areas that Google PageSpeed Insights will check:
|
g: Cumulative Layout Shift - This measures how much unexpected layout shifting happens on a page, like when a button moves around. It shows how stable the webpage is for users. A good Cumulative Layout Shift (CLS) score is below 0.1. |
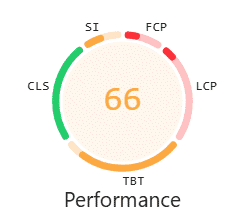
| c: Performance Score - The Performance Score indicates the website's overall grade in specific metrics. You can hover over the score to see a breakdown of how each metric performed. | h: Speed Index - This metric indicates the time it takes for the webpage to look completely loaded. |
| d: First Contentful Paint - This shows how long it takes for the first visual element, like a text or image, to show up on the screen, helping users understand how quickly visitors see something happening on the website. | i: View Treemap - The Treemap displays which files and resources occupy the most space on the page, helping you identify what is slowing it down. |
| e: Last Contentful Paint - This measures how long it takes for the largest, visible part of the webpage, like an image or text, to load. A good "LCP" time is under 2.5 seconds, indicating that users can see the important parts of the webpage quickly. |
Sample interpretation: Using the PageSpeed Performance Report image above as an example, you can see that the website has:
- Slow Last Contentful Paint (LCP) of 5.6s, which means the main content takes too long to load.
- A High Total Blocking Time (TBT) of 220ms indicates that the scripts may be slowing it down.
The LCP and TBT scores contribute more to the lower performance score than the other red/orange metrics.
In the Diagnostics section of the report, you will find the following metrics. (You may need to click on each metric in your report for more details.)
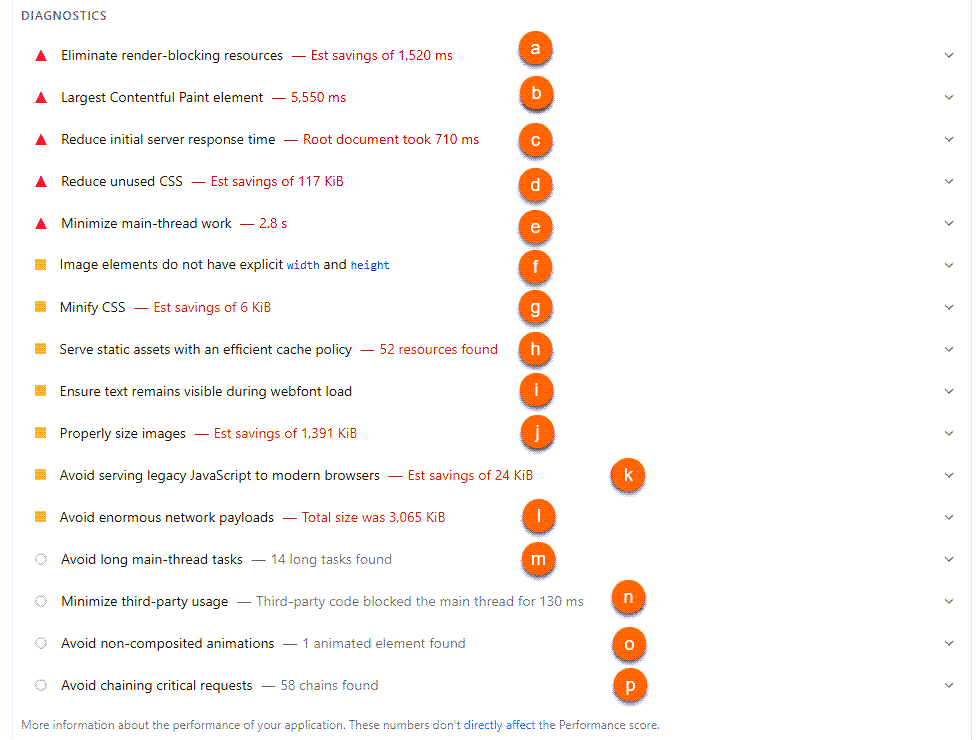
The image above shows sample PageSpeed diagnostic results.
|
a: Eliminate render-blocking resources - Too many prioritized scripts and styles can slow down what visitors see first on your site. This is tied to the longer Total Blocked Time (TBT) shown above.
Prioritizing improves site speed by ensuring important elements load first, even if the background items load later. While plugins can assist with this, it is advisable to have a professional web developer handle the process. |
i: Properly Size Images - Uploading oversized images that are displayed in similar sizes wastes bandwidth and slows webpage load, so its best to use appropriately-sized imges or WordPress tools for optimization. |
|
b: Last Contentful Paint - This measures how long it takes for the largest, visible part of the webpage, like an image or text, to load. The phases are as follows:
|
j: Ensure text remains visible during webfont load - Using fallback text can enhance loading speed by preventing text from being hidden. If the font-display setting is not configured properly, browsers may conceal text until the web font has finished loading. Developers can improve this process by implementing a fallback font that is displayed initially and then swapping it with the final font once it is fully loaded. |
|
c: Reduce Initial Server Response Time - This section shows how long the server took to respond. To speed up your server response time, try using caching, removing unnecessary plugins, picking a faster theme, or switching to Cloud or Dedicated hosting. |
k: Avoid serving legacy JavaScript to modern browsers - Sending old JavaScript to modern browsers adds extra weight and slows loading time. Some themes and plugins add this old code for compatibility, even though most users have modern browsers that don’t require it. By configuring JavaScript tools to deliver only modern code to modern browsers, you can improve loading speed and enhance performance. |
| d: Reduce unused CSS - Too much unused or unnecessary Cascading Style Sheet (CSS) slows the page down. CSS controls the look and layout of a website, but sometimes themes and plugins can load bulky CSS files, not all of which are used. You have to remove or replace plugins heavy CSS plugins or use tools to defer or optimize CSS, ensuring that only the needed styles load first. | l: Avoid enormous network payloads - Payload refers to all files, like images, fonts, and scripts, that a webpage sends to the browser. When a webpage loads too much content, it can slow down performance and increase load times, particularly for mobile users. To improve loading speed, optimize image sizes, implement lazy loading for images, and limit the amount of content shown on the initial load. |
|
e: Minimize main-thread work - Too many scripts and styles can slow down page loading and responsiveness. The main thread manages tasks like running scripts, building layouts, and rendering content. If it’s too busy, the page loads slowly and responds poorly, contributing to Total Blocking Time (TBT). This issue is often caused by heavy or unoptimized JavaScript, excessive effects, or complex styles. To improve performance, use fewer or lighter scripts, defer non-essential JavaScript, and simplify the page layout where possible. |
m: Avoid long main-thread tasks - Heavy JavaScript can slow down pages and make them unresponsive. To improve performance, reduce or defer heavy JavaScript, remove unneeded plugins, and lazy-load content when possible. |
| f: Image elements do not have explicit width and height - This section shows that some images lack width and height. If no specified image dimensions are provided, the browser doesn't know how big the image will be while loading, causing layout shifts that eventually affect the CLS score. | n: Minimize third-party usage - Third-party codes are anything loaded from external sources, such as jQueries, galleries, tracking scripts, etc. Extra code from third-party tools can slow down your page. Try to use fewer plugins and load their scripts after the page has mostly loaded. |
| g: Minify CSS - CSS files can sometimes have unnecessary spaces and codes. Removing these elements can improve site loading speed. Additionally, themes and plugins may include CSS that isn’t fully optimized. Some plugins, like JetPack Boost, can help minify CSS code. |
o: Avoid non-composited animations - Some CSS animations on a page may not be optimized, leading to layout shifts or choppy effects.
Using CSS properties that are meant for animation and are GPU-accelerated can help animations run smoothly. |
| h: Serve static assets with an efficient cache policy - Short cache times lead to unnecessary reloading of static files, slowing down repeat visits, so using a caching plugin or adjusting server settings to set longer cache durations can improve load times. | p: Avoid chaining critical requests - Critical request chains refer to files that must load in a certain order. Slow-loading CSS and JavaScript files, often from plugins and page builders, contribute to the delay. To improve speed, reduce the number of critical files, defer non-essential ones, and optimize loading. |
The Accessibility section of the report shows how easily all users, including those with visual impairments or disabilities, can navigate the site. This is not a full accessibility audit, but it gives a helpful starting point.
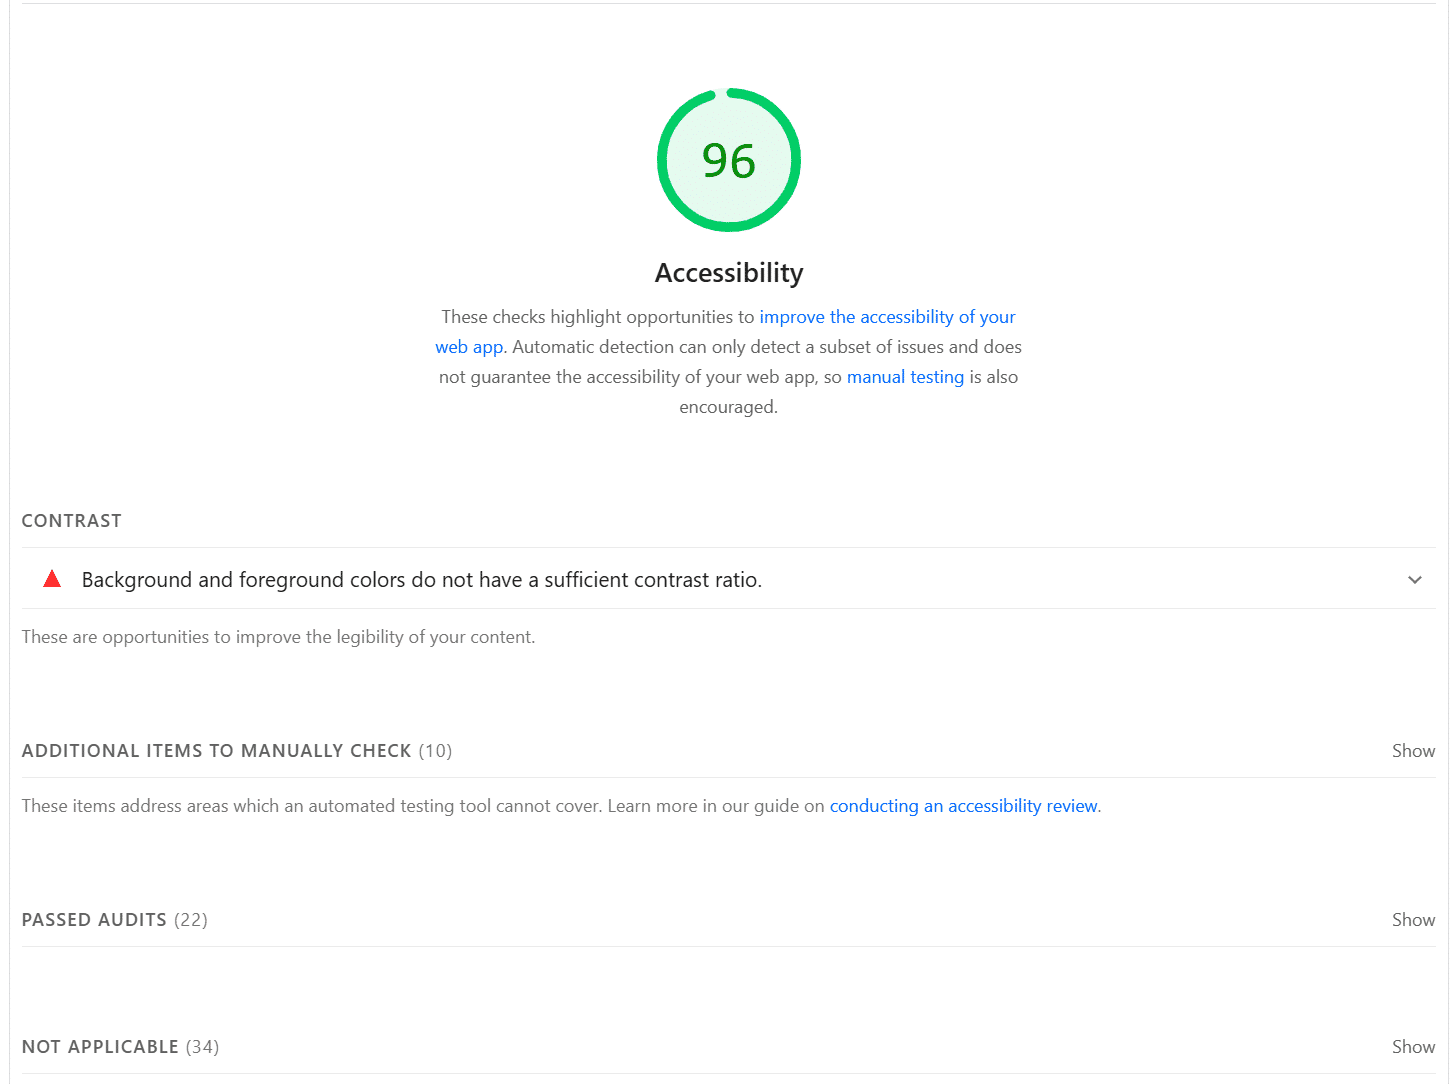
The Additional Items to Manually Check section offers tips and suggestions to enhance site usability for everyone.
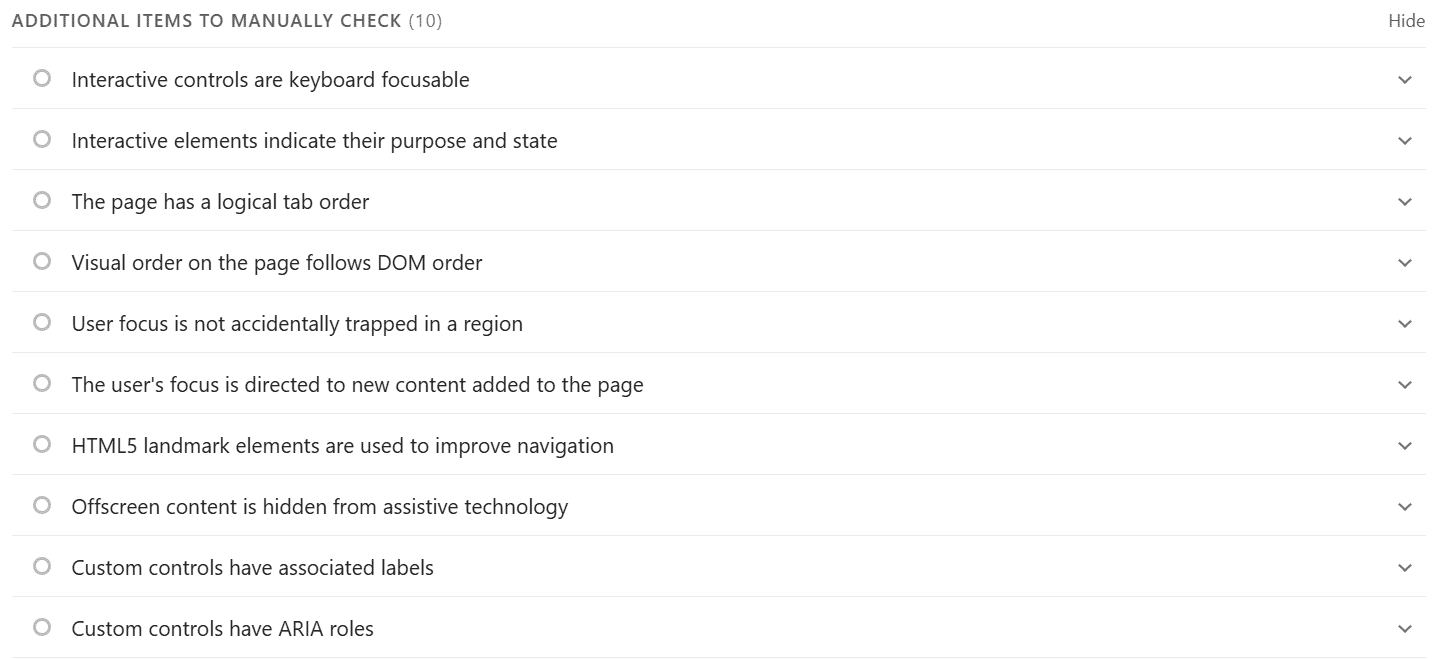
The images above show sample PageSpeed diagnostic results.
The Best Practices section checks for security and modern coding standards to ensure the site is safe and works well across different browsers. These checks include:
- Protection against cross-site scripting (XSS) attacks
- Using secure connections (HSTS)
- Protecting the site from being embedded in other sites (clickjacking protection)
- Using modern ways to separate content between browsers (COOP)
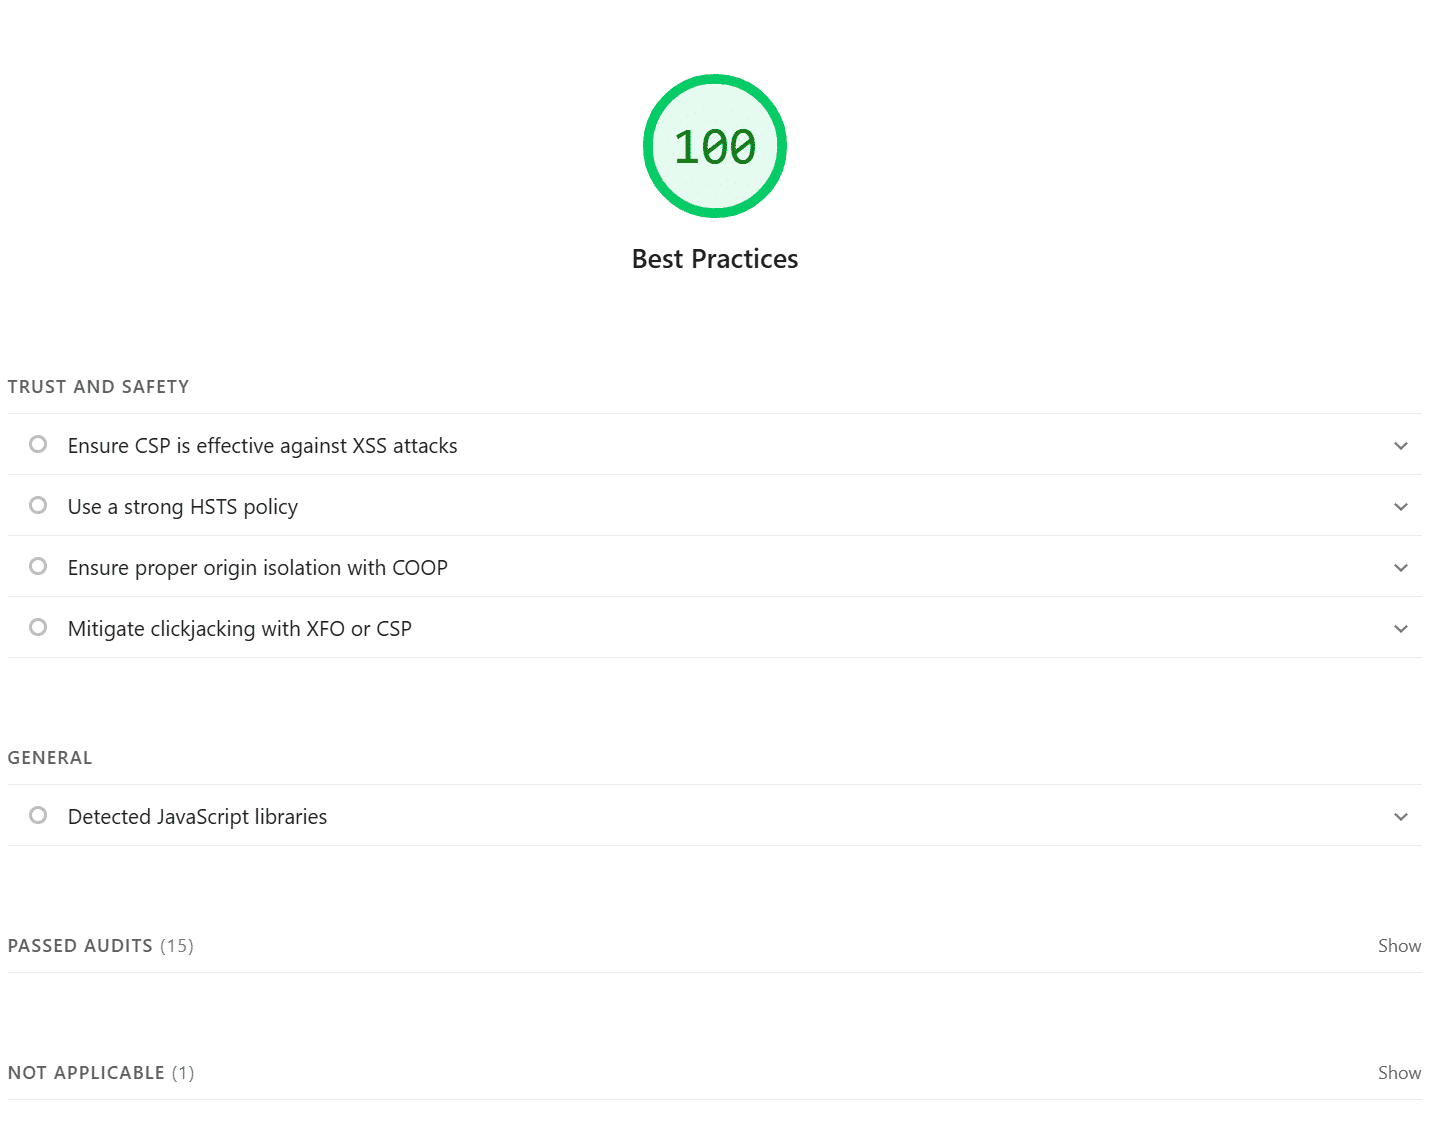
The image above shows sample PageSpeed diagnostic results.
The last section, SEO, ensures that webpages follow best practices to rank higher in search engines like Google or Bing. Plugins like Yoast can help users improve their SEO easily.
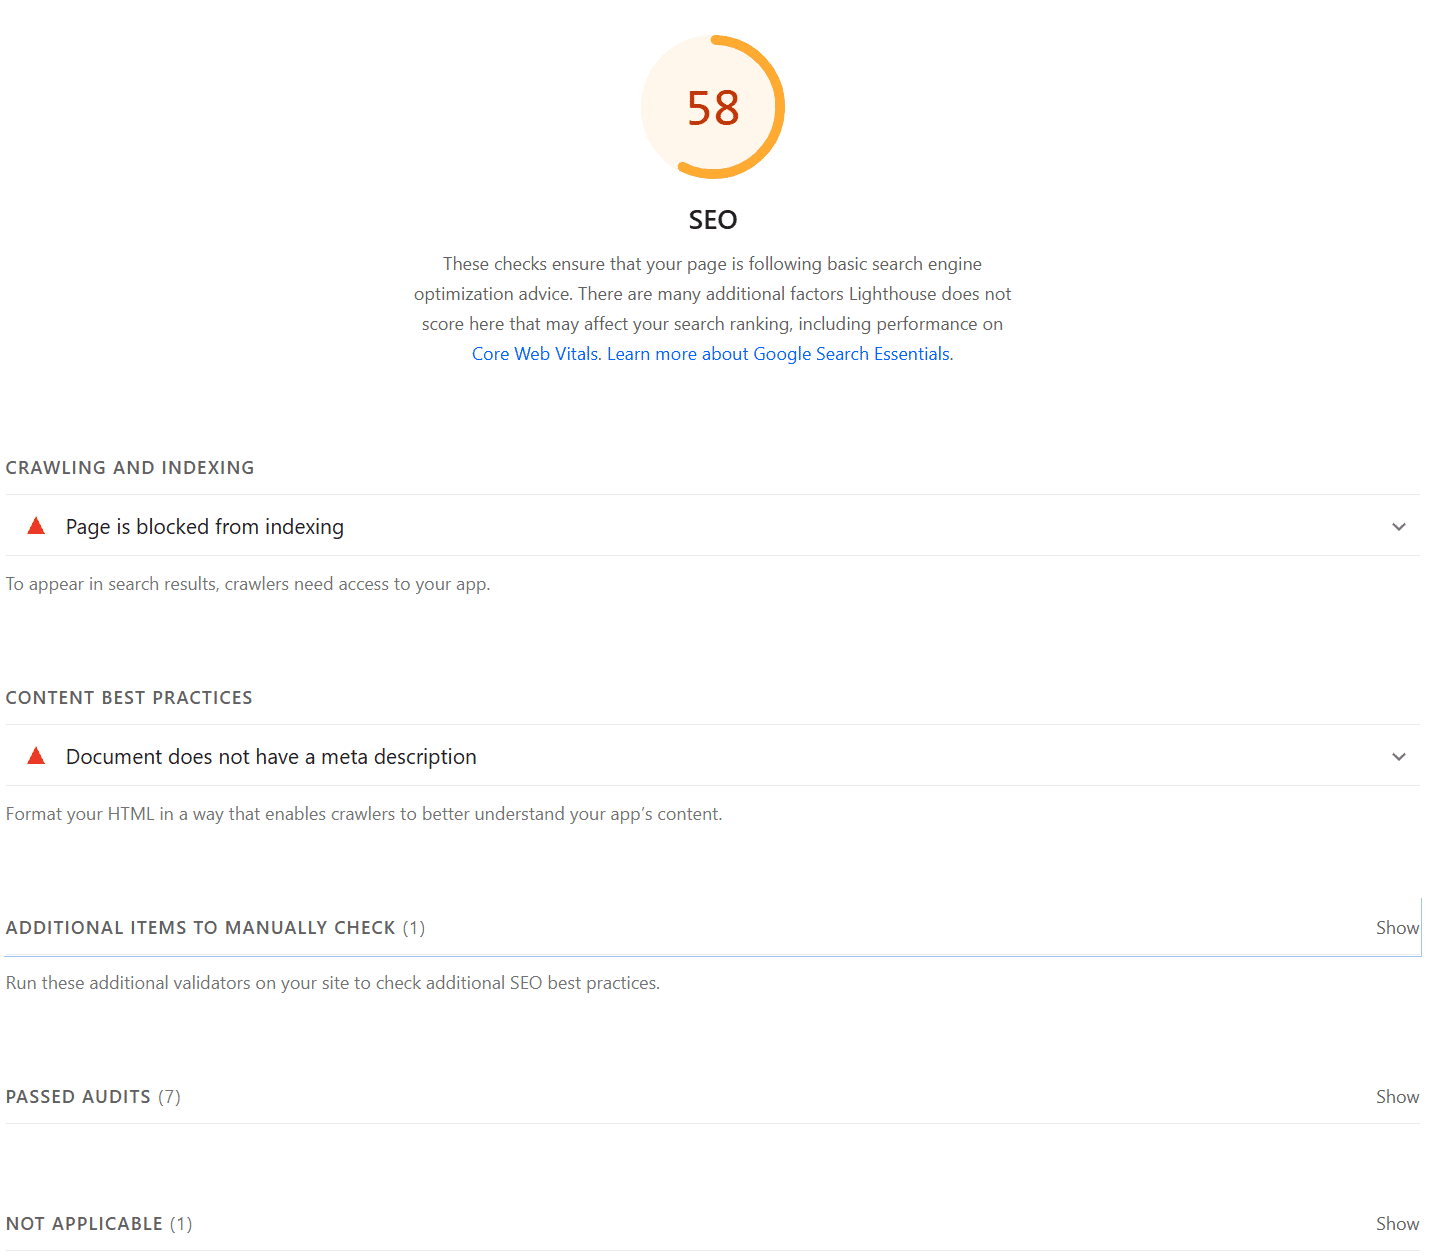
The image above shows sample PageSpeed diagnostic results.
The performance report is designed to give you a general idea of how to optimize your website's speed and performance. If you receive a poor score in any of the areas we have shown above, you may want to check our tips below.
Tips for Improving Website Speed and Performance
Now that you know how your website is performing, you can address common issues identified by the score and metric results.
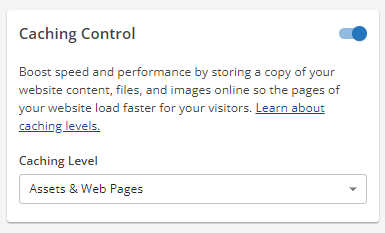
- Enable server caching through your Customer Portal.
Caching stores data and assets on the server and in the browser to speed up future visits to a website. This way, the server and browser don’t have to search for everything from the beginning each time someone visits the site.
You can manage your site's caching control from your Customer Portal's Speed settings.
- Use a CDN (Content Delivery Network) like Cloudflare or SiteLock.
CDN not only helps mask DNS information but it also encourages faster site speeds by optimizing the delivery of information. At HostGator, we offer two CDN options: Cloudflare and SiteLock.
You can manage your Cloudflare within your Customer Portal's Speed settings.
You can also purchase SiteLock, which has an Advanced Web Application Firewall (WAF)/CDN. This is only available on SiteLock Prevent and Prevent Plus plans. The SiteLock Essentials plan includes a basic CDN.
- Set up Expires Headers and GZip Compression in the .htaccess file.
Enabling Expires Headers and GZip compression helps browsers cache data longer and reduces transferred file sizes. These features are activated by adding specific code to the .htaccess file.
- Delete any unused plugins and keep the remaining ones updated.
One of the best ways to optimize a site is to remove unnecessary plugins. It is also recommended to ensure that your themes and any activated plugins are up-to-date for better performance.
- Optimize images with editing software, such as Photoshop or Gimp, before uploading to WordPress.
Large images mean larger file sizes. Reduce the size of your images before uploading them to WordPress to improve your site load speed.
You may also try minifying CSS or JavaScript coding, which refers to rewriting the code to reduce the amount of information the server needs to translate. Both practices can be executed with WordPress plugins, but they tend to be more effective when performed manually. For additional assistance with these steps, it may be advisable to consult a web developer.